View and Analyze CSV, MAT, MDF/MF4, and TXT Measurement Data
Data Sensors opens CSV, MAT, MDF/MF4, and TXT files directly - no conversion step, no separate reader tool - and can also import CAN and CAN FD bus traces decoded against a signal database, displaying any number of channels across multiple strips, with the same multi-axis, dual-cursor viewing engineers expect from tools like ETAS MDA, imc FAMOS, or CANalyzer. No data leaves your machine.
Open CSV, MAT, MDF/MF4, or TXT files directly
Whatever your measurement setup already writes to disk - a plain CSV export, a MATLAB .mat file, or an MDF/MF4 recording from a data logger or ECU - Data Sensors reads it directly. Every channel lands on one shared time axis on open - its own native one for CSV, MAT, and TXT files that already share one, or a resampled uniform grid for MDF/MF4 - so signals originally logged at different rates line up correctly from the first strip you create, without any manual alignment step.
Strips, independent axis grouping, and dual cursors
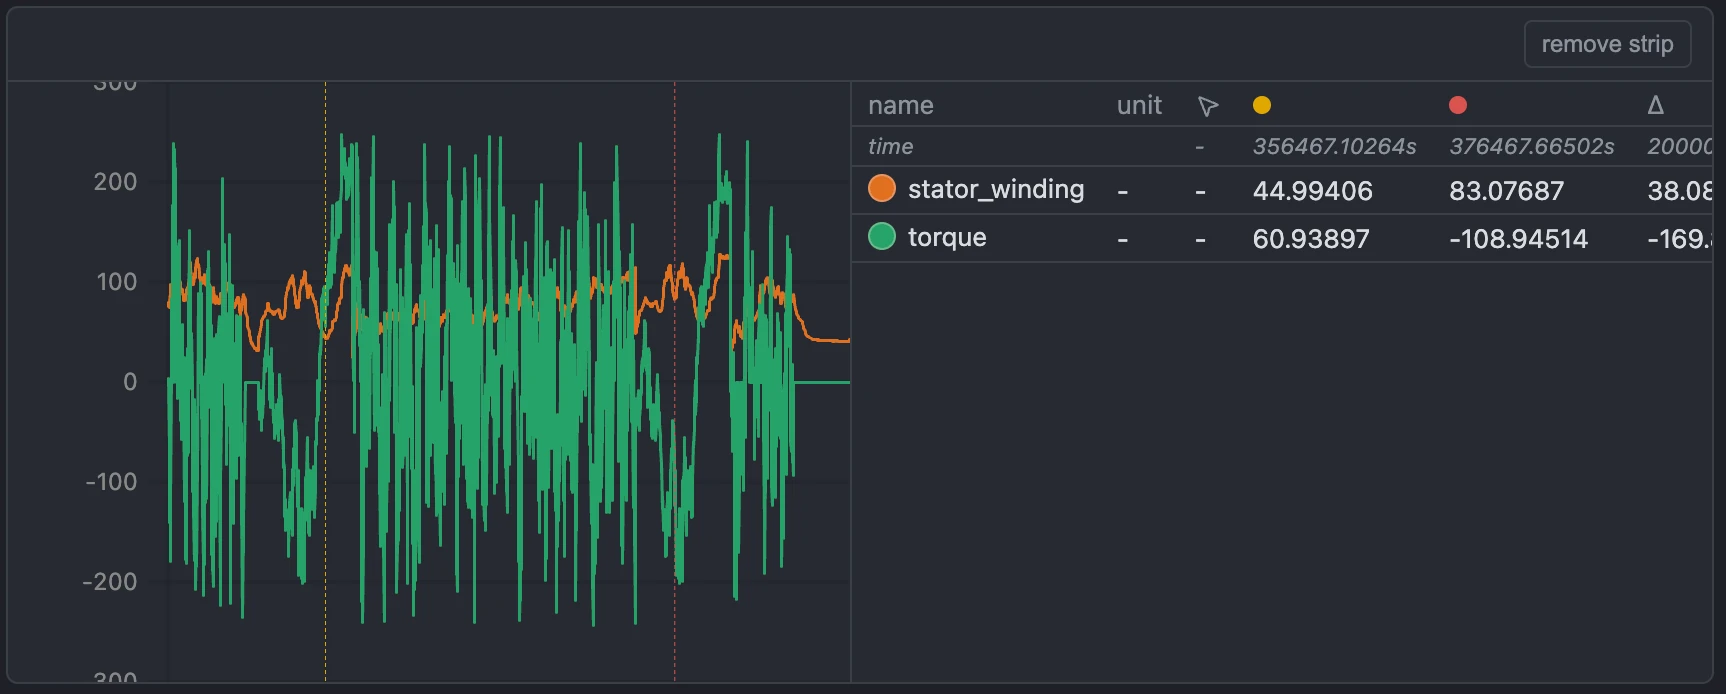
Drag any channel onto a strip, or create as many strips as your analysis needs. Signals sharing a unit group onto one shared y-axis automatically, so a torque channel doesn't get squeezed onto the same scale as an RPM channel by accident. Two draggable cursors show each signal's value - and the delta between them once both are placed - directly in every strip's own values table, with zoom and pan synced across every strip, so all strips stay aligned to the same time window.
Derive new signals with a live formula editor
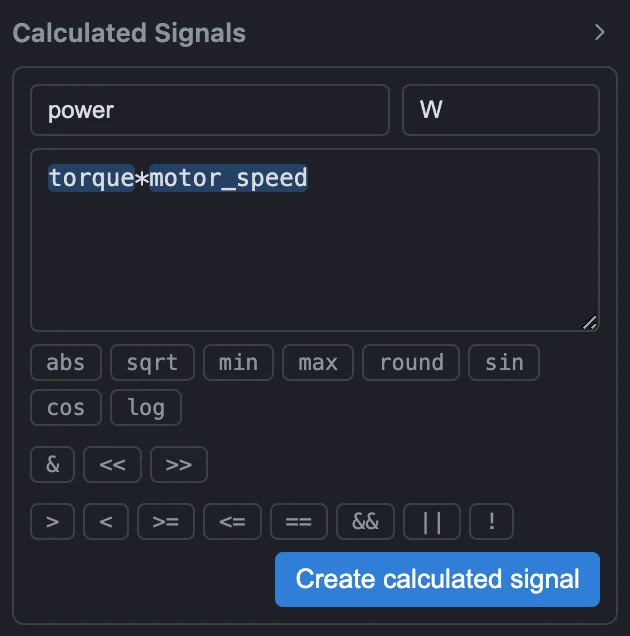
Not every signal you need is one your data logger recorded. Data Sensors' calculated-signal editor lets you write an expression referencing any measured or already-calculated channel by name, with malformed expressions caught on save - useful for anything from a simple unit conversion to combining several raw channels into the exact target signal you want to train a virtual sensor against.
Save your session, export any strip as an image
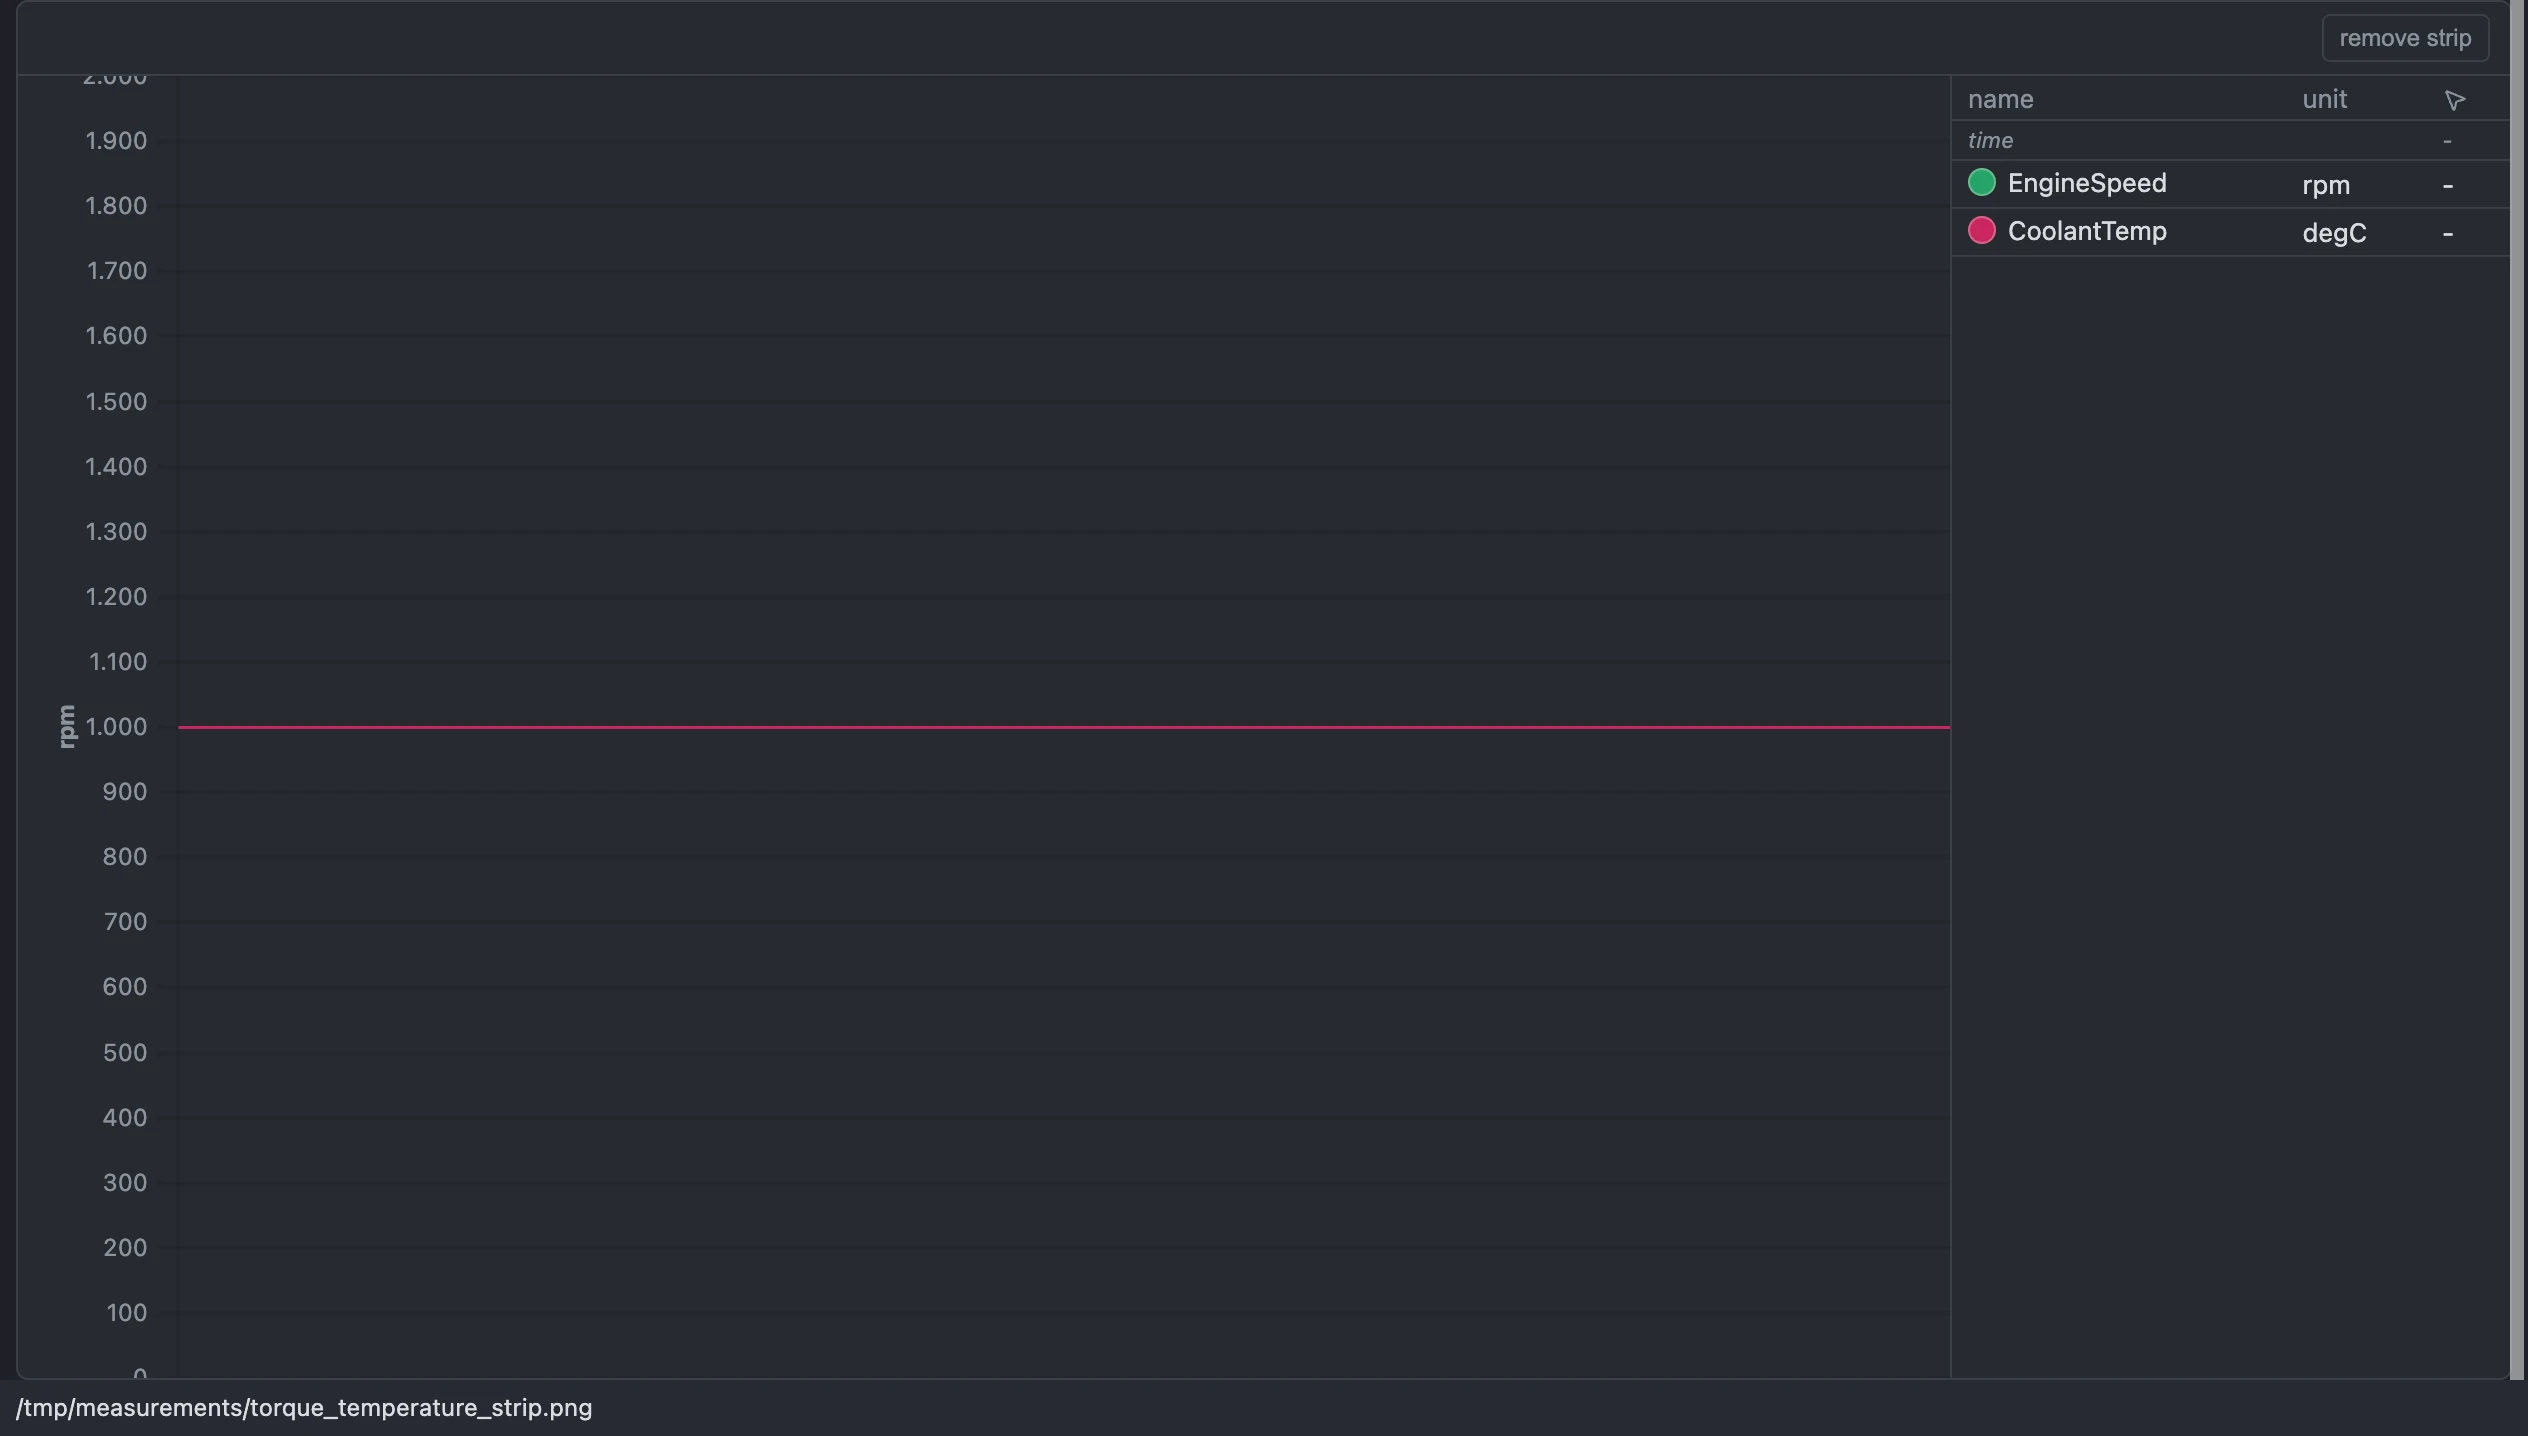
A whole session - strip layout, which signals are on each, calculated signals, virtual sensor signals, and strip background color - saves to a single JSON config file you can reopen later or hand to a colleague. The window title picks up an asterisk the moment something changes, so you always know whether the session on screen matches the file on disk. Any strip, or all of them at once (including ones currently off-screen), can be exported as a PNG for a report, with the source file's own path stamped at the bottom of the image.
Import CAN and CAN FD bus traces
Bring in a Vector .asc or .blf trace and decode it against its .dbc signal database - Data Sensors handles the bit-level extraction itself, including multiplexed signals and both Motorola and Intel byte orders. CAN FD frames, with payloads up to 64 bytes instead of classic CAN's 8, decode through the exact same pipeline. Decoded signals show up exactly like any other measurement: plot them across strips, slice and export a time range, or train a virtual sensor on them, with no separate decoding tool.
