Simulink model viewer
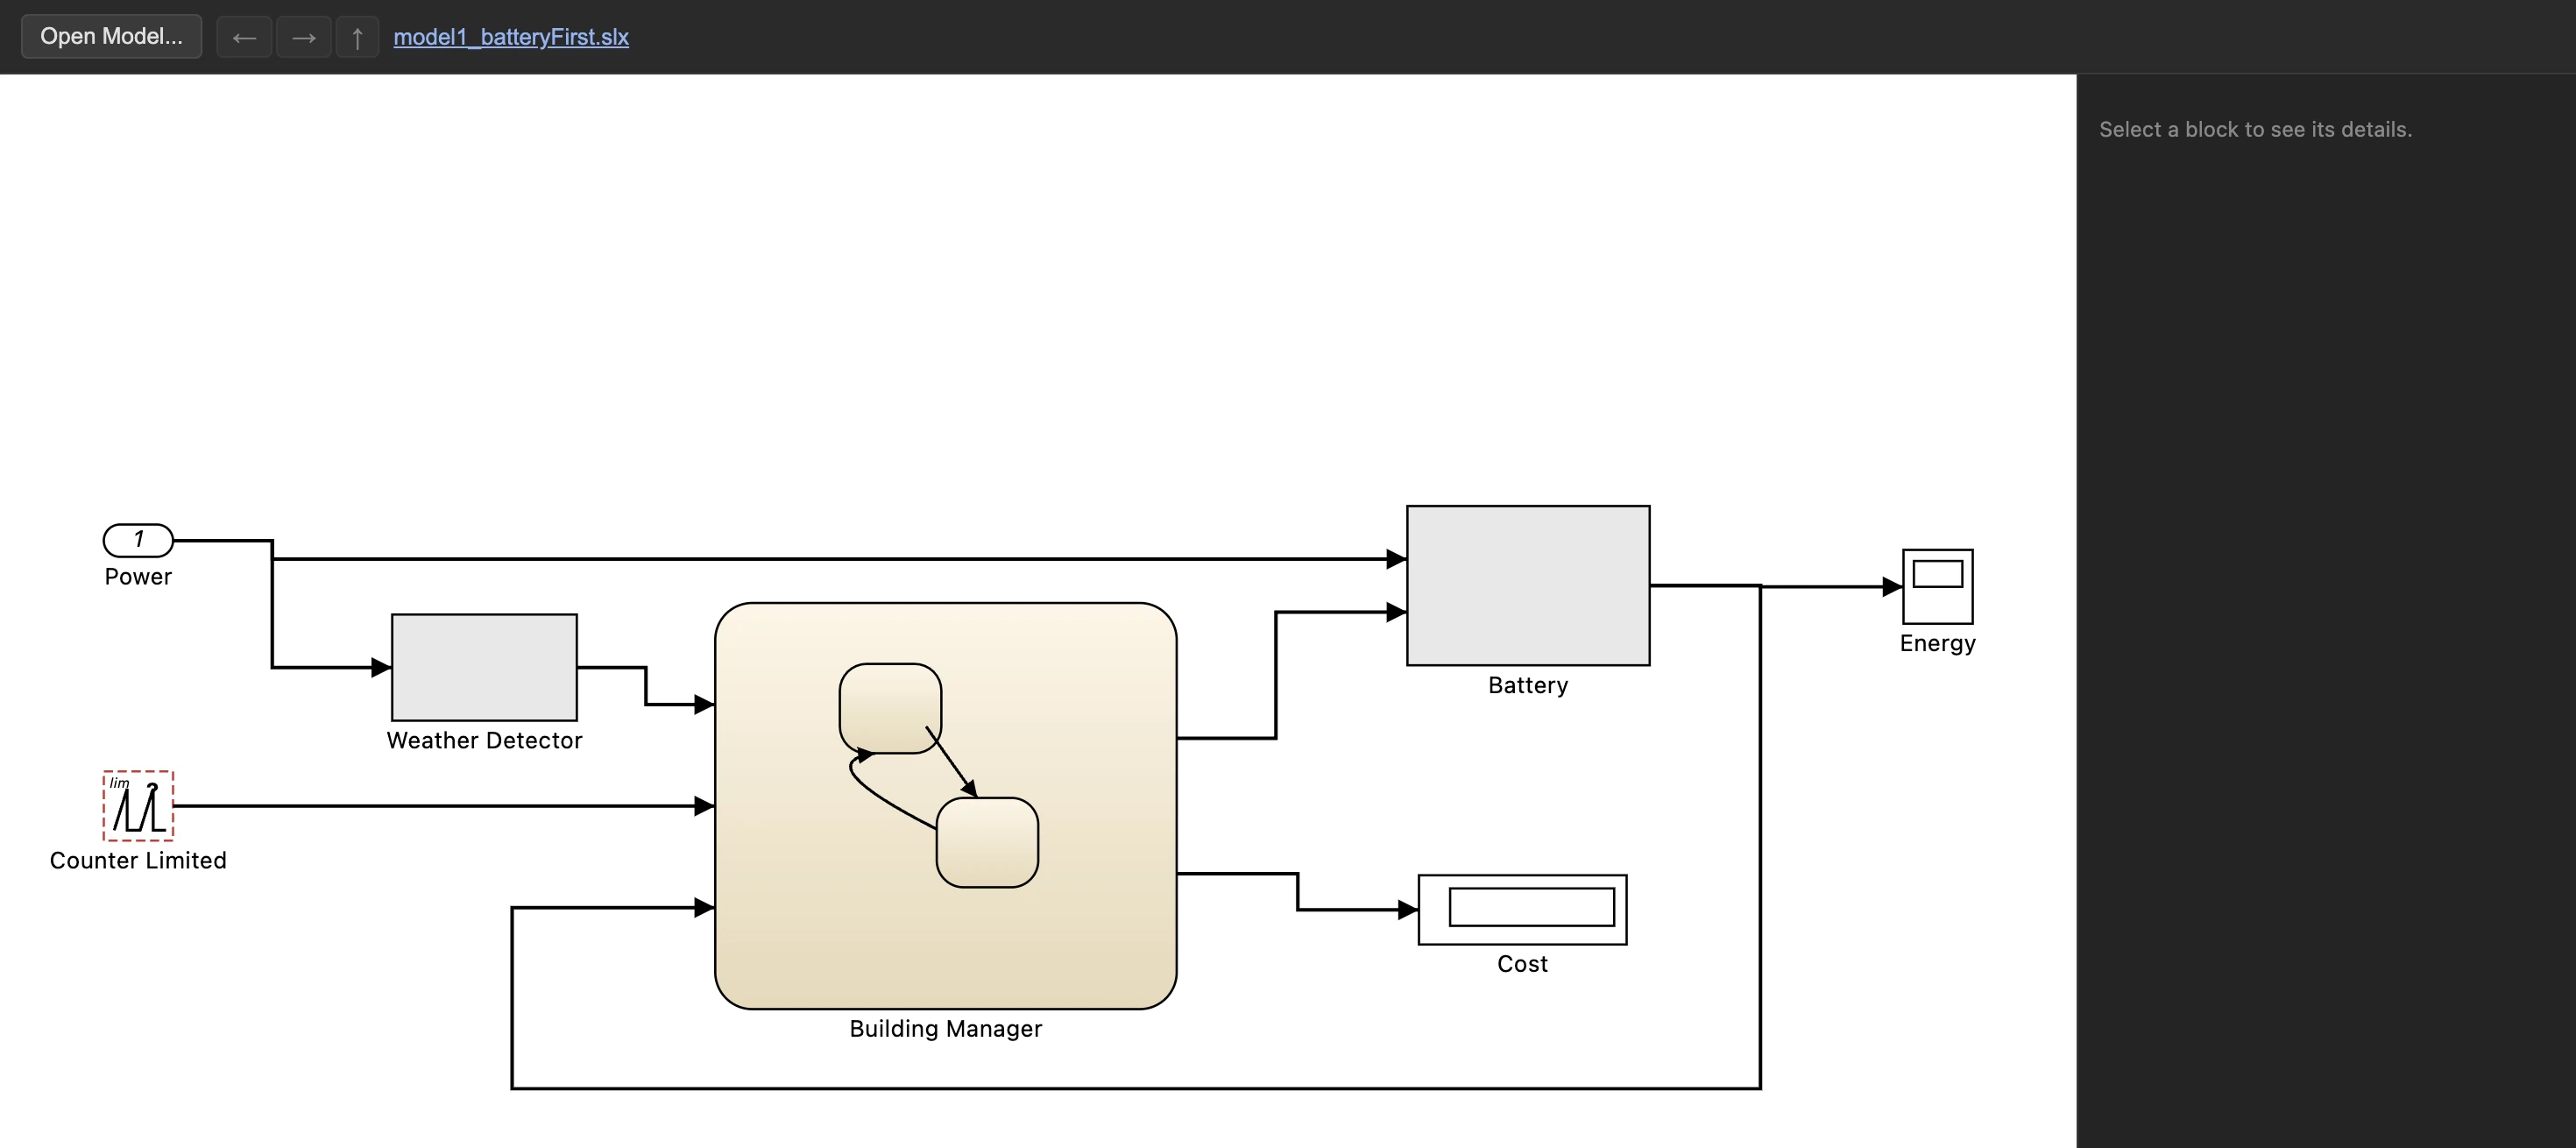
File > Open Simulink Model... opens a .mdl or .slx file's block diagram
read-only, in its own separate window - no MATLAB or Simulink license needed. Double-click a
subsystem to drill into it; the breadcrumb at the top shows the current path and jumps back up to any
earlier level, and the back/forward/up arrows beside it step through your navigation history or go up
one level. The view automatically re-centers and fits itself whenever you navigate. Scroll to zoom
(centered on the cursor, matching MATLAB), the on-screen zoom shortcuts zoom in/out on the canvas
center, and Space fits the whole diagram to the window at any time. Closing the main Data Sensors
window also closes this one.
Every block icon - the common shapes (Gain, Sum, Product, Mux/Demux, Switch, ports, and more) plus
nearly every base-library category (Continuous, Discrete, Math Operations, Logic and Bit Operations,
Signal Routing, Sources, Sinks, Discontinuities, Ports and Subsystems, Model Verification, and more)
- is rendered from the file's own geometry and parameters, not a generic placeholder: a Sum
block shows its actual +/- signs, a Transfer Fcn block shows its actual
numerator/denominator as a fraction, and so on.
Inspecting and tracing
Click a block to see its parameters - straight from the file, no simulation or type resolution attempted - in the right-hand details panel. Click a signal to select it, highlighted in blue; drag a rubber-band selection to select multiple blocks and signals at once. Right-click a signal for three tracing actions: Find real Source jumps straight to the signal's true originating block, passing straight through Goto/From blocks and subsystem in/out ports along the way. Highlight Signal to Source and Highlight Signal to Destinations instead dim the rest of the diagram and highlight the full path back to the source, or forward to every destination (a signal can fan out to more than one), so you can follow it hop by hop across the model at your own pace. A block linked to a Stateflow chart opens that chart on double-click instead of drilling into a subsystem, with nested states shown inline exactly as they'd appear in Stateflow itself.
Lookup tables and what this viewer won't do
Double-clicking a Lookup (1-D) or Lookup 2-D block plots or tables its breakpoint/output data - useful for spotting an authoring mistake like mismatched axis lengths at a glance. When a block's data is a MATLAB expression rather than a literal array, it's shown as-is rather than guessed at - this viewer never evaluates MATLAB code. The viewer is read-only throughout: nothing about the model can be edited, saved, or simulated from here.
Custom-library blocks
A block from a custom library Data Sensors doesn't recognize is outlined in red rather than left blank. Opening a model that contains any automatically shows a picker listing each one - assign it to the closest standard block from a searchable grid showing every candidate's own icon, or click any red-outlined block directly on the canvas to assign just that one. Save or load your assignments as a CSV file, so one mapping covers every model built from the same custom library. An unmapped block still gets a best-effort automatic guess where one's found, but stays outlined in red until you confirm it yourself.