Strips, signals, and cursors
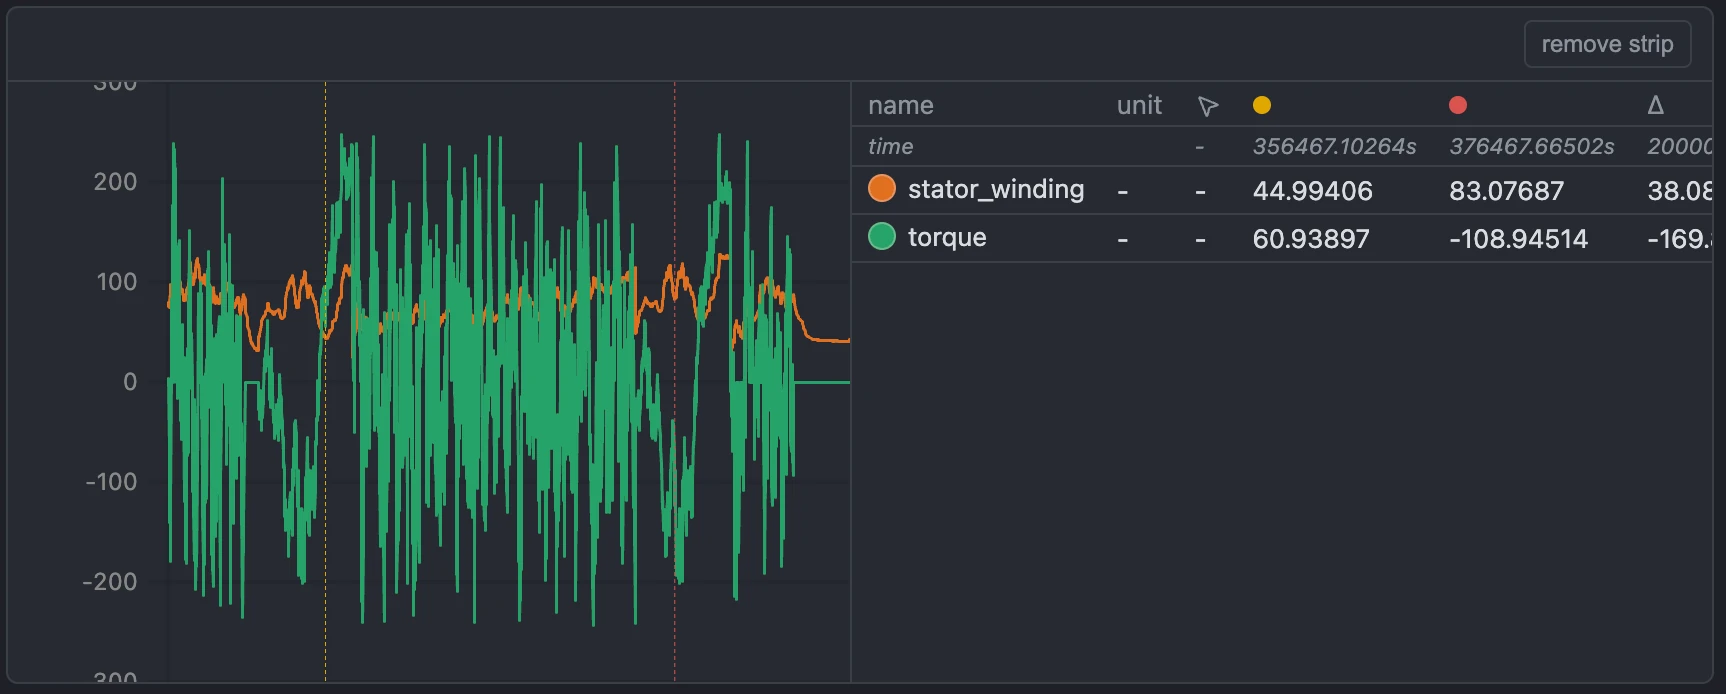
A strip is a plot with its own y-axis grouping. Signals sharing a unit are grouped onto one shared y-axis automatically, so a torque channel doesn't get squeezed onto the same scale as an RPM channel by accident; a per-strip toggle can force every assigned signal onto one shared scale regardless of unit. Dragging a signal's row in the values table reorders it live as you drag, or moves it to a different strip if you drop it there instead of releasing in place.
Right-click-drag on a strip zooms - along whichever axis the drag moves first, so a mostly-sideways drag zooms the shared time axis across every strip at once, and a mostly-vertical drag zooms just that strip's own y-axis. Left-click-drag pans. Up to two cursors can be placed per session (cycle through none → cursor 1 → cursor 1+2 → none while hovering a strip); each placed cursor's value - and the delta between them, once both are placed - shows in every strip's own values table, not just the strip you placed it on.
Ctrl/Cmd+A selects all signals in whichever list you clicked last - a strip's values table, the left-hand signal list, or either side panel (Calculated Signals or Virtual Signals) - each list keeps its own selection independently. Ctrl/Cmd+C then copies the selected signal's name to the clipboard, or a comma-separated list of every selected signal's name if more than one is selected (for example, after Ctrl/Cmd+A).